
Service Utilization Dashboard
Operational dashboard focused on technician utilization, billable time, branch filtering, and effective capacity.
View Case StudyIndependent reporting and analytics specialist
Ledger Crow builds SQL reports, Crystal Reports, Power BI dashboards, scheduled reporting workflows, and Excel/CSV automation that help businesses reduce manual reporting and improve operational visibility.
Analytics work
Operational dashboard focused on technician utilization, billable time, branch filtering, and effective capacity.
View Case Study
A lightweight reporting utility for running saved SQL queries, exporting CSV/Excel outputs, and logging successful or failed jobs. Built to reduce repetitive manual reporting work.
View Case Study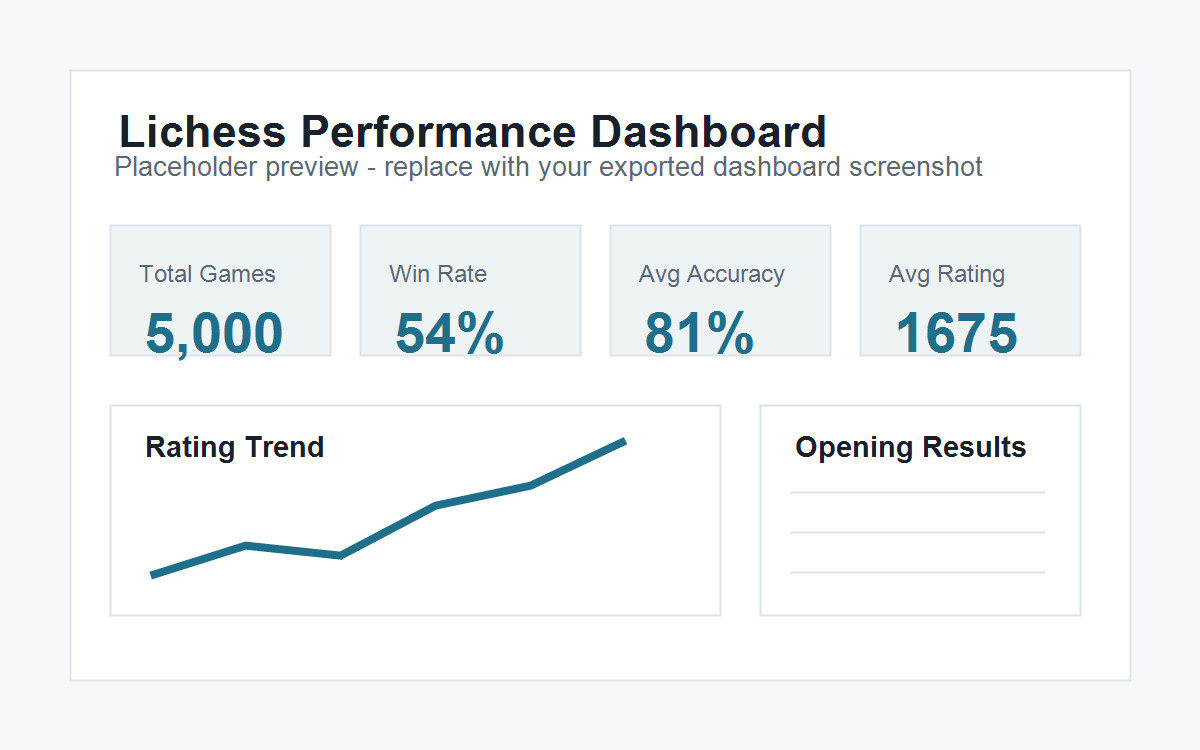
Power BI dashboard analyzing rating trends, win rate, opening performance, monthly game volume, accuracy, and outcomes.
View Case StudyReporting solutions
Queries, stored procedures, exception reports, data extracts, and reporting datasets built for business users.
Support for existing Crystal Reports, report cleanup, field logic review, and modernization planning.
Dashboards that turn operational data into useful views of performance, activity, trends, and outliers.
Lightweight reporting tools that run recurring reports, export files, and reduce repetitive manual work.
Dashboards and reports focused on utilization, volume, exceptions, performance, and business activity.
Repeatable extracts and exports for teams that depend on scheduled spreadsheet-based reporting.
Practical cleanup and workflow improvements that make recurring reporting more consistent and easier to maintain.
Need a report, dashboard, or reporting process cleaned up? Reach out and describe the problem.